Following the rotation of active validators’ consensus keys to ML-DSA on the Dora Vota long-running testnet, we conducted four rounds of transaction load testing. ML-DSA is a post-quantum digital signature algorithm used by validators to sign consensus votes. The benchmark covered conventional transactions signed using ECDSA over the secp256k1 elliptic curve and native transactions signed using ML-DSA.
Across four rounds and 32 regular-load stages, all 360,000 planned transactions were successfully executed and confirmed. Conventional accounts completed 240,000 transactions, and native ML-DSA accounts completed 120,000. No transactions were rejected during mempool admission checks (CheckTx), and none remained unconfirmed at the reporting cutoff in these regular-load stages.
Testnet Validator Consensus Signatures
At block 15867387, all 14 active validators used ML-DSA-65 consensus keys, representing 100% of the active set’s voting power.
Explore: testnet explorer · validator list · consensus validator set at block 15867387. Validator names link to their explorer pages.
| Active validator | Consensus signature type |
|---|---|
| dorafactory-new | ML-DSA-65 |
| ITRocket | ML-DSA-65 |
| Nodes.Guru | ML-DSA-65 |
| StakeUp | ML-DSA-65 |
| 🔥STAVR🔥 | ML-DSA-65 |
| BlockPro | ML-DSA-65 |
| Perfect-nodes | ML-DSA-65 |
| breskulpeak.com | ML-DSA-65 |
| 👋 79anvi 🍀 | ML-DSA-65 |
| Oxistake | ML-DSA-65 |
| Moon Core | ML-DSA-65 |
| [NODERS] | ML-DSA-65 |
| ruangnode | ML-DSA-65 |
| linkednode | ML-DSA-65 |
The active validator list reflects block 15867387. Explorer pages provide live status.
Test Environment and Methodology
The evaluation compares one pre-upgrade baseline run with four post-upgrade runs on the long-running testnet. The upgrade changed both software and validator consensus keys. The comparison captures the overall performance of these two operating environments.
Each transaction contained one MsgSend message with the same sender and recipient address. Conventional accounts used ECDSA signatures over secp256k1, while native ML-DSA accounts used ML-DSA signatures. The two account types were tested in separate stages on the same network, whose validators used ML-DSA consensus signatures after the upgrade.
| Item | Configuration |
|---|---|
| Network |
Dora Vota long-running testnet, vota-testnet
|
| Transaction type |
One self-transfer message (MsgSend) per transaction
|
| Regular target rates: conventional accounts | 100 / 200 / 300 / 400 transactions per second |
| Regular target rates: ML-DSA accounts | 50 / 100 / 150 / 200 transactions per second |
| Submission plan | Target rate × 60 seconds per stage; actual submission took approximately 60–76 seconds |
| Monitoring | One validator, one RPC node, and one archive node, sampled every 10 seconds |
| Load generator | Hosted on the same machine as the RPC node |
The load generator stopped submitting transactions if it fell approximately 20 seconds behind schedule or a test account ran out of funds. Neither condition interrupted the post-upgrade regular-load stages. A separate safeguard stopped load generation if the block interval exceeded 20 seconds. For each post-upgrade regular target-rate tier, the mean block interval observed at the monitored validator, averaged across four runs, was approximately 5.5–6.5 seconds. No recorded stop was attributed to this safeguard. Stop reasons for the 800-transactions-per-second stages are listed separately below.
Eight additional stress stages targeted 800 transactions per second. Their results are excluded from the regular-load completion totals.
Hardware and Service Resource Limits
All three monitored servers used the same hardware: an Intel Core Ultra 7 265 with 20 logical CPUs, 64 GB of DDR5-5600 memory, and two approximately 1 TB Micron 3500 NVMe SSDs in RAID 1. Each physical network interface had a 1 Gbit/s link speed.
| Node | Role | Node service CPU quota | Node service memory limit |
|---|---|---|---|
| Validator | Participate in consensus and execute transactions | Equivalent to 4 cores of CPU time | 12 GiB |
| RPC | Accept transactions and serve queries; share the host with the load generator | Equivalent to 8 cores of CPU time | 24 GiB |
| Archive | Retain historical state and serve historical queries | No service-level limit configured | No service-level limit configured |
The CPU quotas limit the CPU time available to each service; they do not dedicate physical cores. The load generator shared the RPC host but was outside the chain service's 8-core quota.
Transaction Completion
| Account type | Confirmed across four runs | Highest regular target rate | Observed send rate at that target | Confirmed per run at that target |
|---|---|---|---|---|
| Conventional | 240,000 | 400 tx/s | 318.5–362.8 tx/s | 24,000 / 24,000 |
| Native ML-DSA | 120,000 | 200 tx/s | 164.3–178.7 tx/s | 12,000 / 12,000 |
Target rates define the submission schedule. Observed send rates are calculated by dividing submitted transaction counts by actual submission durations; they measure load-generator output, not sustained on-chain throughput.
Before the upgrade, the conventional 400 tx/s stage reached the submission-lag safeguard after sending 23,938 transactions. The remaining 62 transactions were never sent; all submitted transactions were confirmed. After the upgrade, all four runs at this target completed the planned 24,000 transactions.
Changes varied by target rate. At the conventional 100 tx/s target, observed send rates changed from 94.6 tx/s in the baseline to 82.4–89.0 tx/s after the upgrade. At the 400 tx/s target, they changed from 299.3 tx/s to 318.5–362.8 tx/s. Every post-upgrade regular stage completed its planned transaction count.
Observed Transaction Confirmation Latency
At the 200 tx/s target, both account types completed 12,000 transactions per run at similar observed send rates: 168.7 tx/s for conventional accounts and 172.2 tx/s for native ML-DSA accounts, averaged across four runs.
| Metric | Conventional accounts | Native ML-DSA accounts |
|---|---|---|
| Mean observed send rate | 168.7 tx/s | 172.2 tx/s |
| Successfully confirmed per run | 12,000 | 12,000 |
| Mean per-run p50 confirmation latency | 6.0 s | 18.5 s |
| Mean per-run p95 confirmation latency | 10.0 s | 26.5 s |
| Four-run mean block interval at the monitored validator | Approximately 5.5 s | Approximately 6.5 s |
p50 and p95 are percentiles. The p50 is the median confirmation time. A run's p95 is the time within which 95% of its successful transactions were observed as confirmed. The latency values shown here are averages of four per-run percentiles, not percentiles calculated from a pooled transaction sample. Confirmation is recorded when a query detects the committed transaction, so these measurements include confirmation-query delay.
At this target, the mean per-run p95 for native ML-DSA transactions was approximately 2.65 times that for conventional transactions. Before the upgrade, the corresponding p95 values were already approximately 12 seconds and 26 seconds. The difference in confirmation latency between transaction types appears in both the pre-upgrade and post-upgrade results. At the 100 tx/s target, mean per-run p95 values were closer: 9.0 seconds for conventional transactions and 11.0 seconds for ML-DSA. The gap in tail confirmation latency widened at the higher load.
Node Load and Transaction Size
Across the regular-load stages, the highest sampled chain-process CPU usage was 1.97 cores on the validator, 2.99 cores on the RPC node, and 1.61 cores on the archive node. Validator and RPC samples remained below their respective 4-core and 8-core service quotas. The validator's 1.97-core value was a single 10-second sample; adjacent samples were approximately 1 core.
At the shared 100 tx/s target, ML-DSA stages had substantially higher sampled peak network transmit rates:
| Node | Conventional / ML-DSA chain-process CPU (cores) | Conventional / ML-DSA network transmit rate (MiB/s) |
|---|---|---|
| Validator | 0.69 / 0.85 | 0.75 / 9.41 |
| RPC | 0.98 / 1.61 | 4.63 / 27.94 |
| Archive | 0.61 / 1.12 | 1.81 / 21.14 |
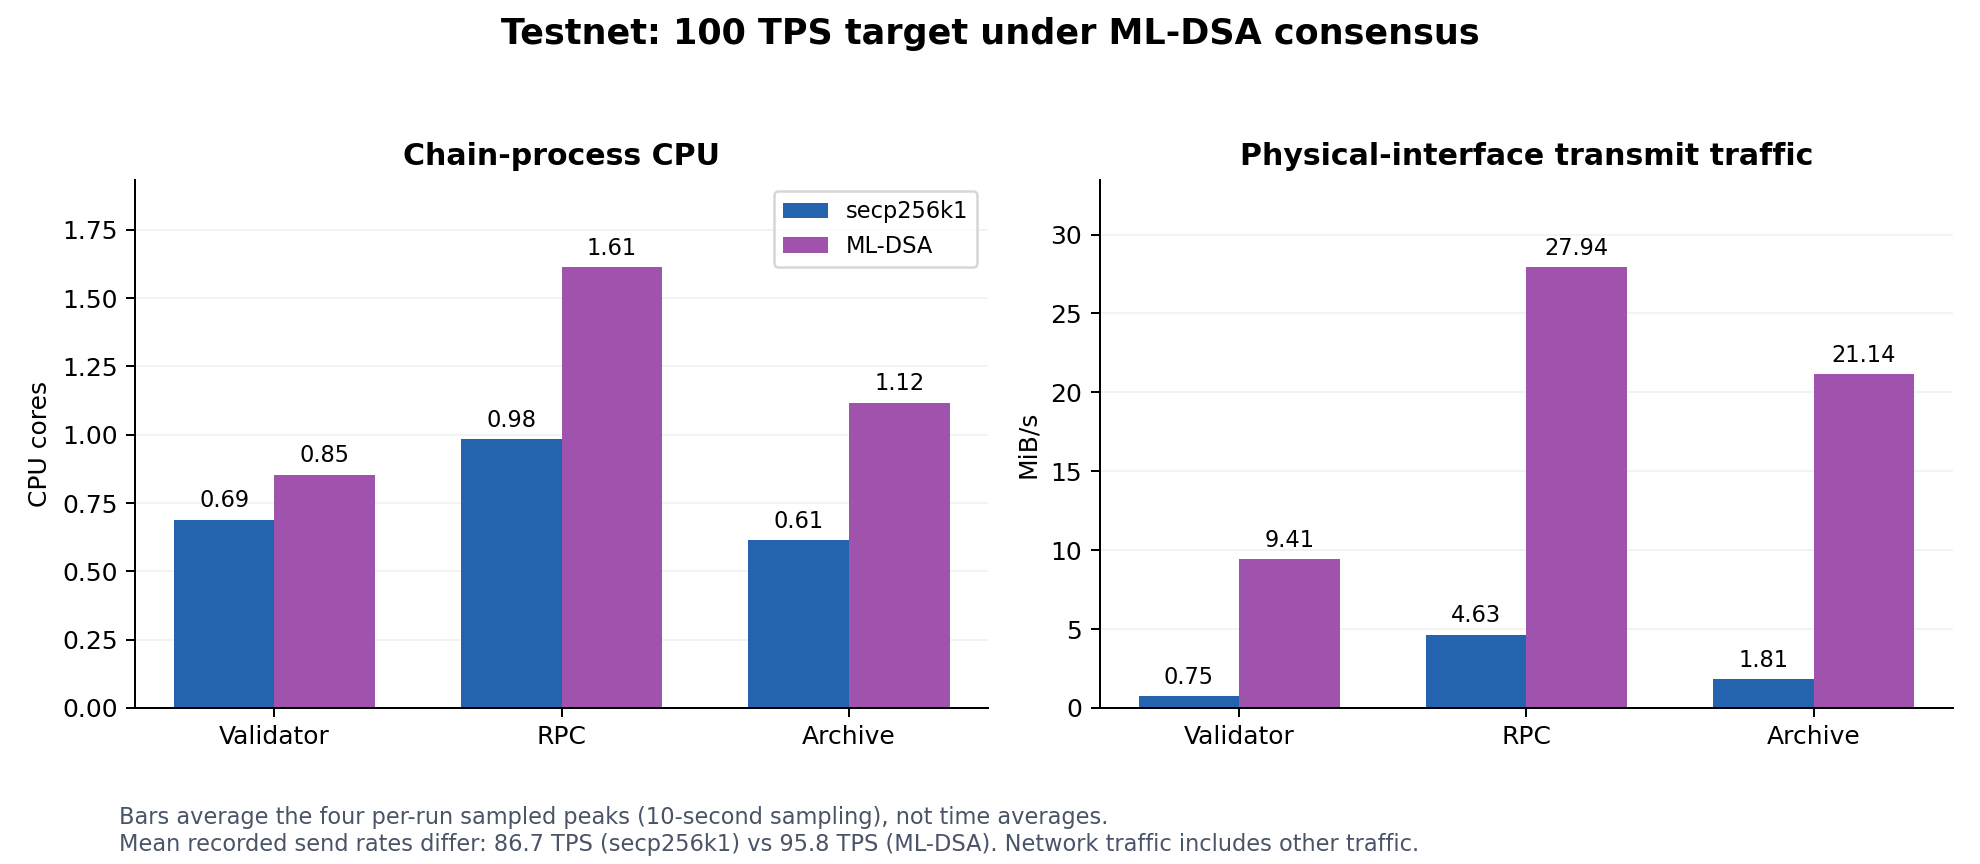
The table and chart show the mean of four per-run sampled peaks for each metric, using 10-second sampling. These are not time-averaged resource usage values. CPU usage is expressed in equivalent fully utilized cores; network transmit rates cover the host interface.
Conventional and native ML-DSA stages had mean observed send rates of 86.7 and 95.8 tx/s, respectively. Interface measurements cover transaction propagation, consensus messages, and other communication.
In the baseline sample, a conventional transaction was 323 bytes, compared with 5,491 bytes for a native ML-DSA transaction—a 17-fold difference.
Block assembly follows protocol parameters including gas limits and block byte limits. Across the four post-upgrade runs, the largest observed number of test transactions in a single block was 4,000 for conventional transactions and 1,034 for ML-DSA transactions. At higher loads, multiple blocks contained 1,034 ML-DSA test transactions, with fewer test transactions per block than observed for conventional transfers.
High-Load Behavior
All eight stages targeting 800 tx/s ended early. Stop reasons included depleted test-account balances, confirmation-query timeouts, and excessive submission lag. Mempools—the queues of transactions awaiting block inclusion—on all three monitored nodes reached 5,000 transactions during these stress stages. These stages show transaction backlog and load-generator stop conditions under high load. Per-stage results appear in the appendix.
Appendix: Stage Results and Measurement Definitions
Regular-Load Submission and Confirmation
The table summarizes send rates and confirmation counts before and after the upgrade. The following chart compares those send rates and the observed p95 confirmation latencies; its horizontal bars show variation across runs, not confidence intervals.
| Account / target rate (tx/s) | Pre-upgrade send rate | Post-upgrade send rate: mean (min–max) | Post-upgrade confirmed / planned per run | Confirmed across four runs |
|---|---|---|---|---|
| Conventional 100 | 94.6 | 86.7 (82.4–89.0) | 6,000 / 6,000 | 24,000 |
| Conventional 200 | 185.1 | 168.7 (157.9–185.6) | 12,000 / 12,000 | 48,000 |
| Conventional 300 | 237.1 | 254.0 (240.2–262.5) | 18,000 / 18,000 | 72,000 |
| Conventional 400 | 299.3 | 346.0 (318.5–362.8) | 24,000 / 24,000 | 96,000 |
| ML-DSA 50 | 46.8 | 48.4 (46.7–50.0) | 3,000 / 3,000 | 12,000 |
| ML-DSA 100 | 100.0 | 95.8 (92.9–99.3) | 6,000 / 6,000 | 24,000 |
| ML-DSA 150 | 144.4 | 133.6 (125.3–145.0) | 9,000 / 9,000 | 36,000 |
| ML-DSA 200 | 163.6 | 172.2 (164.3–178.7) | 12,000 / 12,000 | 48,000 |
| Total | — | — | 90,000 / 90,000 | 360,000 |
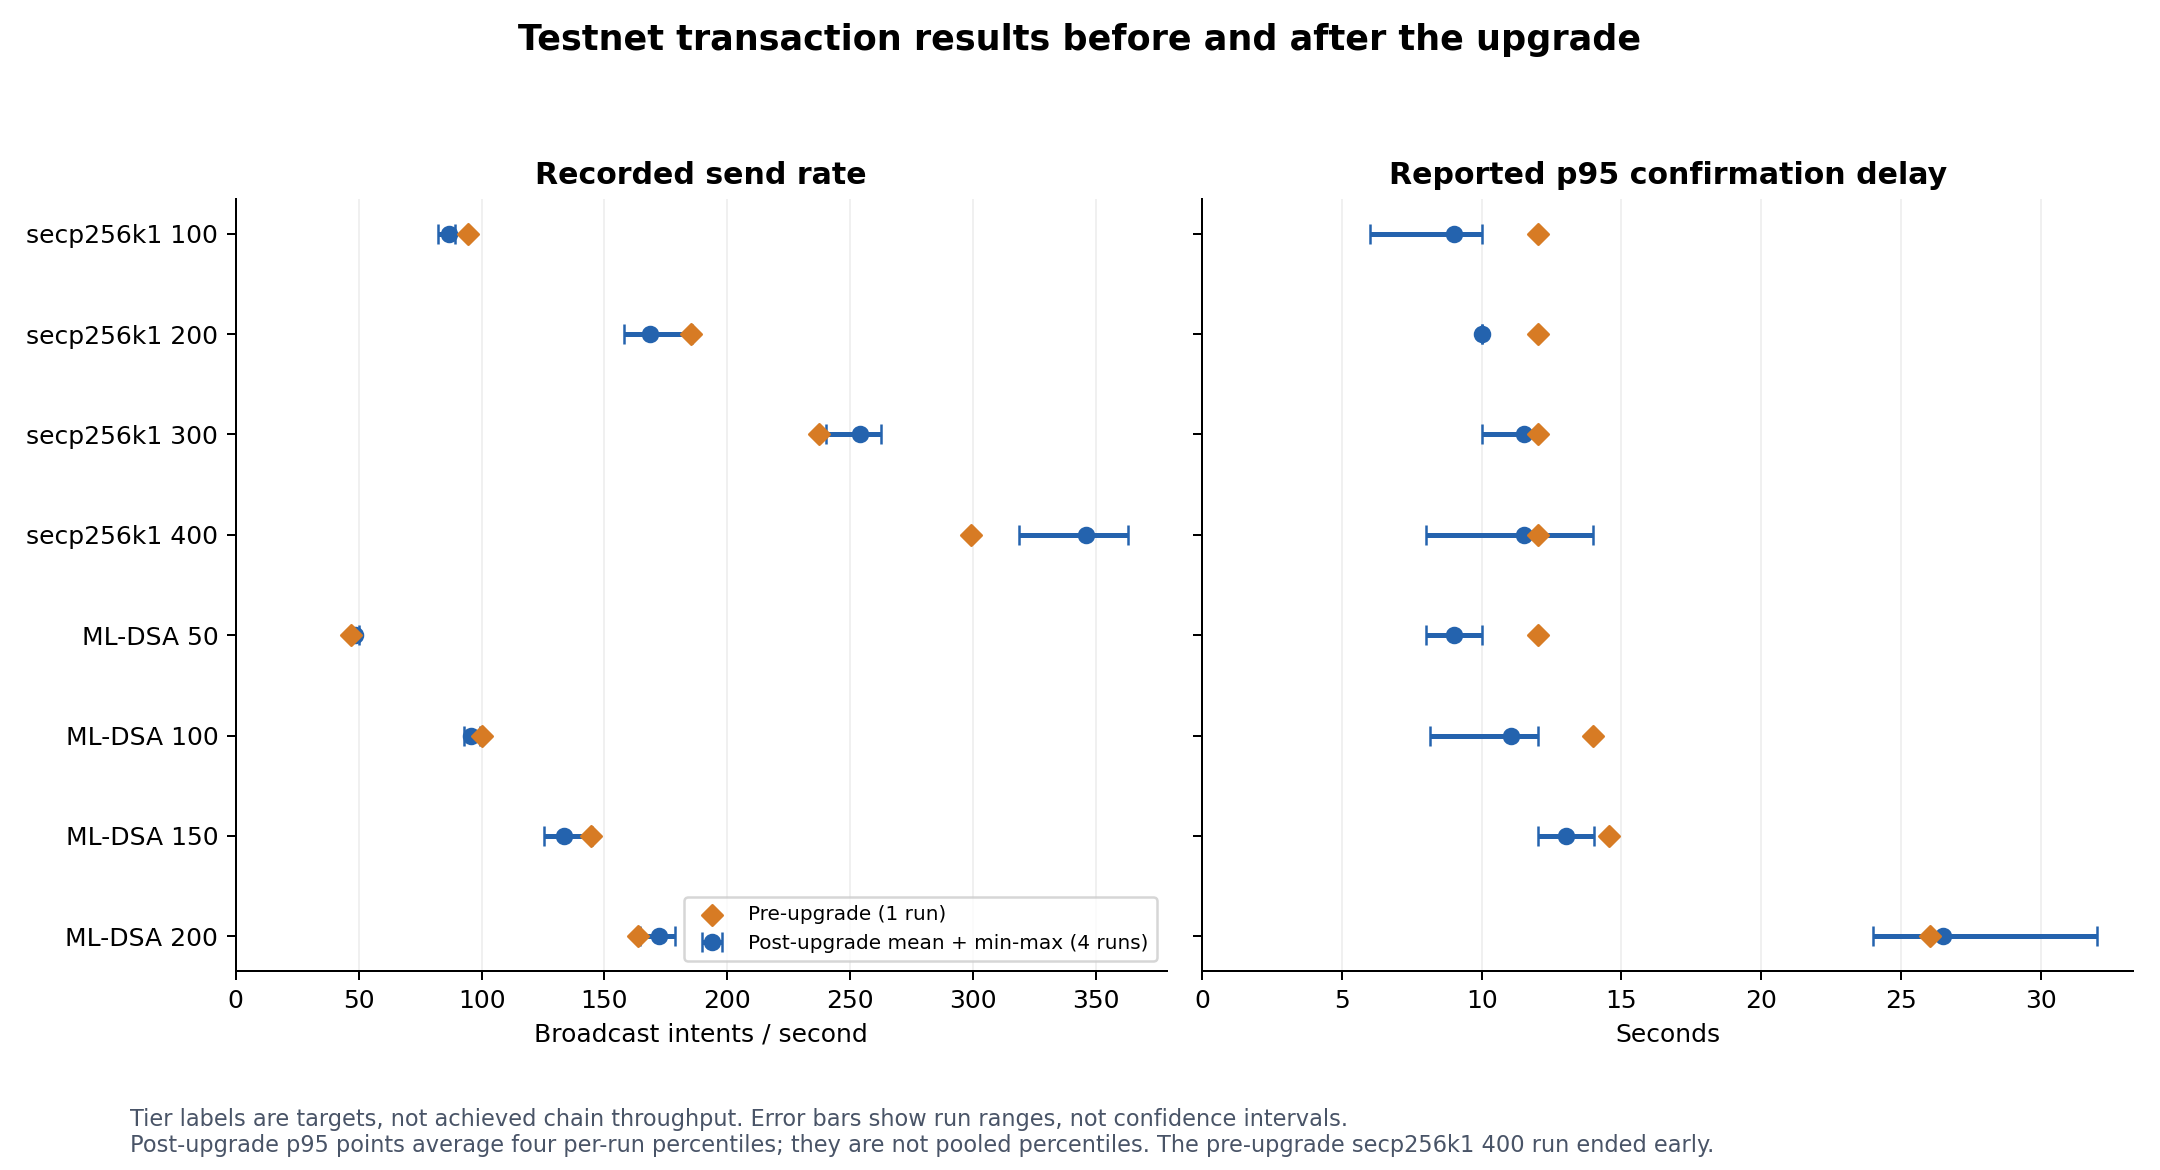
Blue points show post-upgrade means across four runs; horizontal bars show the minimum-to-maximum range. Orange points show the single pre-upgrade baseline run. Conventional accounts are labeled secp256k1 in the charts.
Stages Targeting 800 Transactions per Second
| Account | Run | Submitted | Confirmed | Unknown at cutoff | Stop reason |
|---|---|---|---|---|---|
| Conventional | 1 | 26,369 | 22,569 | 2,493 | Insufficient test-account funds |
| Conventional | 2 | 29,759 | 26,348 | 2,846 | Insufficient test-account funds |
| Conventional | 3 | 23,000 | 20,000 | 1,704 | Confirmation-query timeout |
| Conventional | 4 | 26,564 | 23,241 | 2,165 | Insufficient test-account funds |
| ML-DSA | 1 | 14,617 | 9,617 | 4,766 | Approximately 20.9 s behind the submission schedule |
| ML-DSA | 2 | 15,688 | 10,688 | 4,988 | Approximately 20.8 s behind the submission schedule |
| ML-DSA | 3 (makeup) | 16,044 | 11,044 | 5,000 | Approximately 23.6 s behind the submission schedule |
| ML-DSA | 4 | 15,170 | 10,170 | 5,000 | Approximately 20.2 s behind the submission schedule |
Unknown denotes an outcome unconfirmed at the reporting cutoff. The eight stress stages recorded 28,962 unknown outcomes. Submitted totals also exceed the combined confirmed, unknown, and mempool-admission rejection counts by 4,572 transactions, whose final outcomes have not been individually verified. Stress-stage results are presented using these classifications.
Measurement Notes
- Hardware and service quotas were checked after testing. The opening active-validator list reflects a separately queried block height.
- Account sequence checks matched in every regular-load stage, totaling 360,000 completed transactions across 32 stages.
- Latency statistics cover successful transactions. Percentiles are calculated per run and then averaged across four runs. Timing ends when confirmation is observed through a query, incorporating queueing, processing, and confirmation-query waits.
- Block intervals are stage averages. Resources were sampled every 10 seconds until 15 seconds after submission ended; reported peaks are sampled peaks.
- RPC chain-process CPU is measured separately, while the load generator and node share host resources.
- RPC monitoring was interrupted for approximately 23 minutes after the conventional-account portion of the third run. Its ML-DSA portion was completed in a separate time window, and missing samples remain missing.
- The evaluation uses one pre-upgrade baseline and four post-upgrade runs, with actual submission windows of approximately 60–76 seconds per regular stage.
Conclusion
Under the regular loads tested, the Dora Vota long-running testnet successfully processed and confirmed all 360,000 planned transfers, including 120,000 native ML-DSA transactions. These results demonstrate the existing nodes' ability to support native ML-DSA transfers within the evaluated load range.
Both conventional and native ML-DSA accounts completed every regular-load stage. At mean send rates of approximately 169–172 tx/s, their mean per-run p95 confirmation latencies were 10.0 seconds and 26.5 seconds, respectively. Native ML-DSA transactions were 17 times the size of conventional transactions in the baseline sample and generated more network traffic during testing, with longer confirmation waits at higher loads.
During regular-load testing, sampled CPU peaks were 1.97 cores on the validator and 2.99 cores on the RPC node, below their respective service quotas. Both conventional and native ML-DSA transfers completed their respective regular-load tests on a network using ML-DSA validator consensus signatures.